
Average Weather Conditions
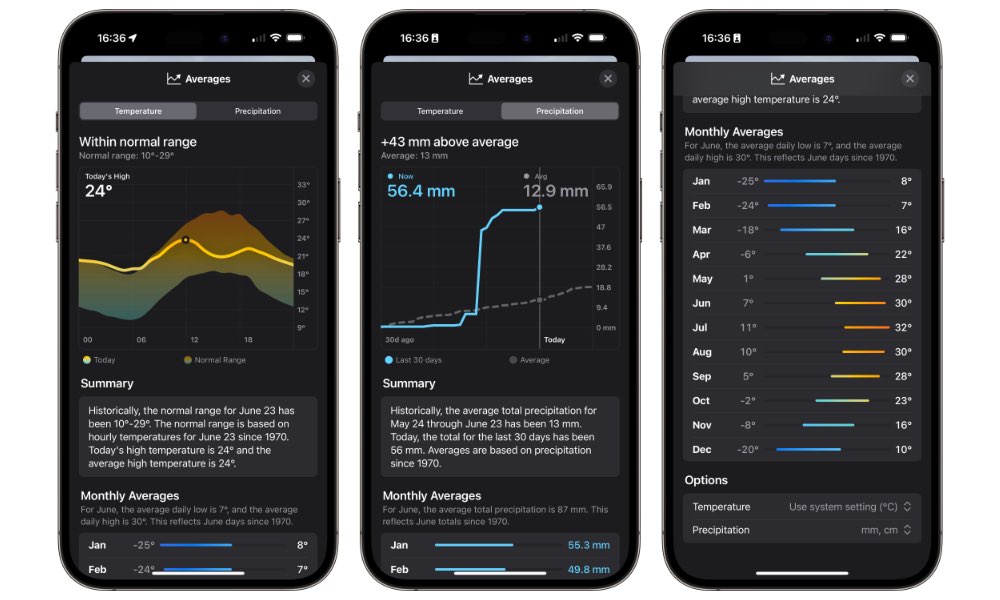
The other new card hosts a new “Averages” section that will let you compare today’s temperature and precipitation with historical averages since 1970.
For temperature, you’ll see a chart showing the temperature range over the last 50+ years compared to a solid line that shows how today’s temperature compares. A similar chart will show an average baseline for precipitation compared to today’s actual rainfall.
Scrolling down will reveal the average temperature and precipitation ranges for each month of the year, along with options to change the units of measurement for both.